Part III of The Nuclear Fuel Cycle: A Complete Primer
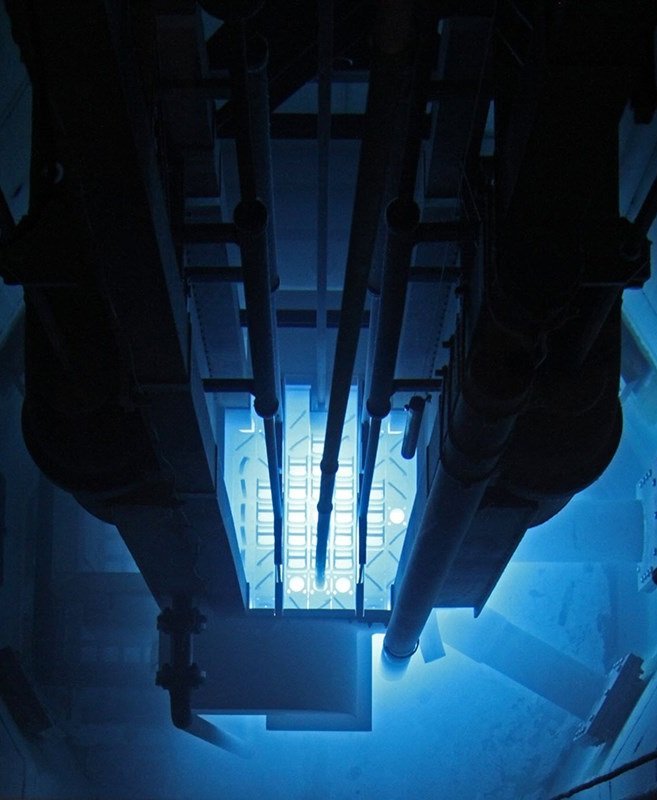
Chapters 8–12 take the fuel assemblies that leave the fabrication plant and put them in a reactor. They establish how a chain reaction is sustained and controlled, how reactor design has evolved across its generations, what makes a reactor safe, what a reactor can produce besides electricity, and where the world’s fleet stands today. The Part moves from physics to engineering to safety, then outward to applications and to the fleet country by country. Three facts carry forward into the later Parts: decay heat of about 7% of operating power at shutdown, which no design can switch off; a Generation IV fleet that needs fuels the Generation II supply chain was not built to make; and a fleet of about 440 reactors consuming roughly 65,000–70,000 metric tons of uranium a year, whose spent fuel is the subject of Part IV.
Chapter 8 — Reactor Physics
From assembly to chain reaction. A fuel assembly is inert until it is loaded into a core. When a U-235 nucleus absorbs a neutron, it splits into two fission products and releases two or three neutrons and about 200 million electron volts, against a few electron volts for a chemical reaction. The fragments’ kinetic energy becomes heat as they slow. The multiplication factor k is below 1 in subcritical material, exactly 1 in the normal operating state of a power reactor, and above 1 in supercritical material. The engineering task is to hold k at exactly 1 while fuel composition, temperature, absorption and geometry change over months and years.
The moderator. Fission neutrons are born in the million-electron-volt range, moving at roughly 5% of light speed. U-235’s fission cross-section is much larger for slow neutrons, so most reactors slow them first. Energy transfer is most efficient between similar masses, and a neutron striking hydrogen can lose nearly all its energy in one collision, which is why water moderates the light-water reactors. Heavy water slows less per collision but absorbs fewer neutrons, which suits reactors designed for natural uranium. Graphite needs more collisions but absorbs few. Fast reactors use no moderator: fast neutrons fission U-238 above a threshold energy and yield more neutrons per fission, and U-238 breeds plutonium-239, the property Chapter 15 develops.
Control and delayed neutrons. Fuel depletes and fission products accumulate, some of them strong absorbers. The most important is xenon-135, formed by the radioactive decay of iodine-135; it can temporarily suppress power after shutdown or a power reduction, an effect called xenon poisoning. The criticality balance must hold through a fuel cycle of three to five years. Control rods of boron, hafnium or cadmium absorb neutrons, and full emergency insertion is a scram. What makes control possible on mechanical timescales is timing. About 99.35% of fission neutrons are prompt neutrons, emitted within a trillionth of a second. The remaining 0.65% are delayed neutrons, released seconds to minutes later by decaying fission products, which stretches the effective neutron lifetime to tenths of a second. A boxed note identifies prompt criticality, criticality on prompt neutrons alone, as the condition a weapon requires. Power reactors are designed to need the delayed fraction.
The negative temperature coefficient. The book calls this physical relationship, built into the design, the most important safety property of a light-water reactor. As core water heats, it expands, holds fewer hydrogen atoms per unit volume, and slows fewer neutrons to the energies at which U-235 captures them efficiently. Fewer fissions mean less heat. The reactor self-limits without human action, moving parts or electrical power, like a ball in a bowl, and the feedback operates continuously.
The RBMK contrast. The coefficient works because one fluid is both moderator and coolant. The Soviet RBMK used at Chernobyl separated them: graphite moderated and water cooled. When the water boiled or was lost, absorption fell while graphite moderation continued, so power rose and drove off more coolant, the ball on the hill. This positive void coefficient was a known characteristic, managed by procedures that prohibited low-power operation. The accident came during a low-power test run in violation of those procedures with safety systems disabled. The coefficient did not cause the accident by itself, but once events began it made the physics work against control. The coupled architecture is the reason the book gives for the LWR’s commercial dominance.
Decay heat. A boxed note marks the limit of the temperature coefficient: it says nothing about the period after shutdown. The chain reaction stops within seconds, but fission products keep decaying. Their decay heat is about 7% of operating power immediately after shutdown, about 1.5% after an hour and about 0.5% after a day, still 15 MW for a 3,000 MW thermal reactor. The box concludes that decay heat removal was the problem at the root of both Three Mile Island and Fukushima.
Thermal efficiency. The Carnot limit sets maximum efficiency at one minus the ratio of cold to hot reservoir temperatures in Kelvin. LWR coolant runs at about 315 °C and the cold side at 25–40 °C, giving a Carnot maximum near 47%. Real LWRs reach 33–35%, so about two-thirds of core heat is rejected, a constraint coal and gas steam cycles share. Helium-cooled high-temperature gas-cooled reactor (HTGR)s at outlet temperatures of 700–950 °C, and molten salt reactors, could reach 40–50% or serve process heat uses such as thermochemical hydrogen production above 700 °C.
Beyond heat. The core is also a source of neutron flux, the number of neutrons crossing a unit area per unit time. That flux depletes U-235, breeds plutonium, alters structural materials and transmutes targets into isotopes. A biological shield of several feet of concrete and steel holds site-boundary doses to fractions of a millisievert a year, below the 1 mSv public limit. A boxed note adds that the fission-product component of spent fuel reaches radioactivity comparable to the original ore within about 300 years, depending on the metric, while long-lived actinides need geological timescales. The chapter closes on capabilities, from district heating to process heat approaching 1,000 °C, and on constraints: decay heat, fission products, materials damage and the efficiency ceiling.
Chapter 9 — Reactor Generations
Seventy years of design. Calder Hall in Cumbria connected to the grid in 1956 as the first commercial nuclear station; Obninsk’s earlier 1954 connection is classed as experimental. Generation I machines, from the late 1940s to the early 1960s, proved the concept. Calder Hall was carbon dioxide-cooled and graphite-moderated and also made weapons plutonium. Shippingport in Pennsylvania reached criticality in 1957 as the first US electric plant devoted to peacetime use, with pressurized water as coolant and moderator, the architecture that came to dominate. Generation I reactors are essentially all retired.
Generation II. Built from the late 1960s to the early 1990s, these plants make up the overwhelming majority of today’s fleet. PWRs, which keep the primary coolant from boiling, account for about 70% of operating reactors by unit count; BWRs boil it in the vessel. Canada’s CANDU uses heavy water as moderator and coolant, refuels online and runs on natural uranium; about 30–35 CANDU and related PHWR units operate worldwide. The fleet has logged about 18,000–19,000 reactor-years. Three Mile Island and Fukushima, both Generation II, showed that systems built on independent-failure assumptions remain vulnerable to correlated failures. A boxed note puts the world fleet’s average age at about 30 years, with many plants on extensions to 60 or 80 years.
Generation III+ and its costs. Generation III and III+ designs, from the 1990s on, added passive safety features, more robust containment structures, standardized designs and digital instrumentation. The AP1000 is the most widely deployed: four units at Sanmen and Haiyang in China, and Vogtle Units 3 and 4 in Georgia, online in 2023 and 2024 as the first new US commercial units in about 30 years. The 1,600 MW electric EPR operates at Taishan 1 and 2 and at Olkiluoto 3, which entered commercial operation in 2023. Vogtle, estimated at about $14 billion, was completed at about $35 billion; Olkiluoto 3, projected at about five years, took nearly eighteen. The book reads these largely as first-of-a-kind costs.
The fast breeder record. “Fast breeder reactors work.” EBR-II in Idaho ran from 1964 to 1994, producing electricity and demonstrating pyroprocessing. Russia’s BN-600 has operated since 1980 and the BN-800 since 2016; the BN-1200M received a construction license in 2025, with first concrete scheduled for 2027 and commercial operation targeted for 2034. China’s 600 MW CFR-600 was approaching commissioning in 2026. Superphenix, Dounreay’s prototype and Clinch River were canceled on economics, since cheap uranium undercut breeding. Superphenix ran from 1986 to 1997 before a Socialist-Green coalition shut it; Astrid was canceled in 2019 as a budget decision. The US holds about 700,000 metric tons of depleted uranium as feedstock, and the book calls deployment a policy and economic question.
Generation IV. The Generation IV International Forum named six reference technologies: sodium-cooled fast, lead-cooled fast, gas-cooled fast, very high temperature, supercritical water-cooled and molten salt reactors. Sodium fast reactors and HTGRs are closest to Western deployment; thorium designs form a branch outside the six. TerraPower’s Natrium at Kemmerer, Wyoming, uses HALEU uranium-zirconium metallic fuel and sodium coolant, is designed for a closed cycle compatible with pyroprocessing, and adds molten salt storage. The reactor never changes power while electrical output varies between about 345 MW and 500 MW, an answer to midday curtailment. Cogeneration follows the same logic: a reactor beside an industrial user can put to work the two-thirds of its heat an LWR rejects.
Designs reaching the ground. Kairos Power’s Hermes 2 broke ground in Oak Ridge, Tennessee, on April 17, 2026, the first power-producing Generation IV reactor to receive an NRC construction permit. This first commercial-scale fluoride salt-cooled high-temperature reactor (FHR) will deliver up to 50 MW electric to the TVA grid under a power purchase agreement with Google, using TRISO pebbles and a fluoride salt coolant above 600 °C. X-energy’s Xe-100 is an 80 MWe helium-cooled pebble bed module at about 750 °C, four to a 320 MW plant, with Dow’s Seadrift, Texas site as anchor customer. Oklo’s roughly 15 MWe Aurora uses metallic high-assay fuel and heat pipes; the NRC approved its Principal Design Criteria in May 2026, and its fast flux can make actinium-225 and astatine-211 for targeted alpha therapy. A boxed note on HALEU (10–20% U-235) states that no Western facility produces it at commercial scale and that the reactors are advancing faster than their fuel supply.
SMRs. The book defines SMR as a deployment philosophy: reactors below 300 MWe, factory-built in standardized units, using Generation III+ or IV technology. The case rests on manufacturing learning curves, as with jet engines and gas turbines. No SMR has reached serial production, and anchor customers (DOE, TVA, the military, Dow) are meant to break the chicken-and-egg problem. Rolls-Royce and Great British Energy – Nuclear signed a contract on April 13, 2026 for three units at Wylfa. Ontario Power Generation’s BWRX-300 at Darlington received its CNSC construction license in April 2025, becoming the first SMR under construction in a G7 country.
The fuel cycle consequence. Generation II infrastructure (UF₆ conversion, centrifuges optimized for 3–5% enrichment, ceramic pellet fabrication) was built for one technology. Generation IV needs different enrichments, fuel forms and sometimes chemical systems. Fuel infrastructure takes five to fifteen years to bring into operation, so it must be built in parallel with the reactors.
Chapter 10 — Safer Reactors
The problem every reactor must solve. Control rods stop the chain reaction in seconds; decay heat continues. It starts near 7% of operating power, roughly 200 MW for a large reactor, and one day after shutdown a large reactor still produces 15–20 MW. The chapter reads the history of serious accidents as a history of decay heat removal failures. At Three Mile Island in 1979 the chain reaction stopped within seconds, but inadequate cooling led to partial core melt. At Fukushima Daiichi in 2011 the tsunami arrived 40–50 minutes after the earthquake and disabled the backup diesel generators. In both cases the reactor physics worked and the safety systems failed. The defining question is whether a design requires active cooling to prevent fuel damage or makes certain damage modes physically impossible.
Generation II: defense in depth. Generation II plants answered with multiple independent cooling paths: several coolant loops, an emergency core cooling system (ECCS), redundant electrical systems with diesel backups, and the barriers of cladding, pressure vessel and containment building. The book calls this sound engineering, reflected in a largely uneventful record. Its limit is the design basis. At TMI a stuck valve, ambiguous instrumentation and operator error combined; at Fukushima one tsunami removed backup power from three units at once. Defense in depth assumed independent failures, and both accidents involved correlated ones.
Generation III+: a waypoint. Passive systems rely on gravity, natural circulation and stored thermal mass. In the AP1000, elevated tanks drain by gravity through the reactor, and water flows over the steel containment to carry heat away by evaporation and natural convection. That removes the dependence on diesels and pumps that proved critical at Fukushima. The system is rated for 72 hours with no power, operator action or external water supply; after that the tanks need resupply and the fuel still makes decay heat. A boxed note frames the distinction: “A system that buys time and a design that eliminates the failure mode are different things.”
Generation IV: TRISO. TRISO kernels sit inside four layers of pyrolytic carbon and silicon carbide that retain fission products above 1,600 °C. Failure fractions were below one in 100,000 in the Department of Energy’s Advanced Gas Reactor qualification program at Idaho National Laboratory. In a properly designed HTGR, the thermal mass and geometry of graphite and fuel keep peak temperature below that threshold even with complete loss of coolant, power and active safety systems. For fission product retention, the book says, the fuel is the primary containment, and the safety argument becomes physical rather than probabilistic.
Molten salt and the freeze plug. In a molten salt reactor the fuel is dissolved in a salt that is already liquid, with no cladding to breach and no pressurized coolant to lose. A section of drain pipe at the bottom of the vessel is actively cooled to keep its salt frozen. If power is lost, the plug melts and the fuel drains by gravity to a passively cooled catch basin shaped so criticality cannot resume. Shutdown then holds without operators, power, moving parts or a fixed time limit.
Three accidents. At TMI-2 in March 1979, a stuck-open relief valve, an ambiguous reading and a mistaken response melted about half the core; krypton-85 was later vented deliberately, and no radiation deaths occurred. At Chernobyl Unit 4 in April 1986, an unauthorized low-power test with safety systems disabled produced a power surge, steam explosion and graphite fire. Twenty-eight workers and firefighters died of acute radiation syndrome, two died in the explosion and one of a cardiac event, for 31. UNSCEAR’s 2008 report counted about 15 thyroid cancer deaths, with up to 60 more projected, mainly among people exposed as children through contaminated milk. About 350,000 people were displaced, and the 2005 Chernobyl Forum judged mental health the largest consequence beyond the radiation deaths. At Fukushima in March 2011, the tsunami after the magnitude 9.0 earthquake overtopped the seawall and fuel melted in three reactors. No member of the public died from radiation, a finding supported by WHO and UNSCEAR; a small number of occupational deaths have been recognized, and about 2,200 deaths are attributed to the evacuation.
Regulation and insurance. The US framework rests on probabilistic risk assessment built for Generation II designs. The NRC’s Part 53, finalized in early 2026, is a technology-neutral licensing pathway that lets advanced non-LWR applicants make physics-based safety arguments. Insurance under the Price-Anderson Act has been priced on Generation II accident data. The book holds that physical preclusion of a failure mode is a categorically different argument from low probability, since low-probability events do happen.
The record. Our World in Data’s synthesis, drawing on UNSCEAR, WHO and epidemiological studies and including Chernobyl and Fukushima, puts nuclear at about 0.03 deaths per TWh, against wind at about 0.04, gas at 2.8 and coal at 24.6. The figures shift with methodology; the ordering holds. Perception diverges from the record, with policy consequences. After Germany’s post-Fukushima closures, gas and coal filled the gap, and the dominant finding of published studies is that the resulting pollution mortality exceeded Fukushima’s radiation mortality, though their methods are contested. The book argues that physics-based Generation IV safety closes the perception gap by removing the large releases that make nuclear accidents culturally distinctive.
Chapter 11 — Nuclear Beyond Electricity
Three outputs. A reactor produces heat, electricity made from that heat, and neutron flux that transforms materials into isotopes. Electricity, in the book’s framing, is one reactor product among several. Many of the economy’s largest energy uses are not electrical, and a low-temperature LWR and an HTGR may both make power without serving the same industrial heat market. The chapter widens the frame before the book turns to the fleet: reactors are heat sources, neutron sources and industrial platforms.
Process heat. Steel, cement, glass, chemicals and refined metals need heat from 300 °C to over 1,500 °C. About 10% of global CO₂ emissions come from industrial heat that low-temperature renewables cannot supply and where electrification is impractical or immature. Natural gas dominates these processes. X-energy’s agreement to site an Xe-100 at Dow’s Seadrift, Texas complex is the most advanced commercial case, with Dow taking electricity and process steam from one installation.
Hydrogen. Reactor output can also be converted into hydrogen and stored. Low-temperature electrolysis achieves about 25–30% efficiency from primary energy through storage and fuel-cell reconversion. Solid oxide high-temperature electrolysis above 700 °C reaches about 40–50% because heat substitutes for part of the electricity. The sulfur-iodine cycle, the most developed thermochemical route, needs more than about 850 °C, beyond current LWRs. Its theoretical efficiency approaches 50% from heat to stored hydrogen, with no dedicated electricity supply. A boxed note describes a reactor at constant power diverting heat to hydrogen when demand is low; the storage medium has no cycle-life limit and no geographic constraint.
Water. Nuclear desalination serves water-scarce regions with continuous output. The reverse osmosis used in most modern plants needs about 3–5 kWh of electricity per cubic meter of fresh water, a large continuous load at city scale. The IAEA has documented nuclear desalination as technically demonstrated since the 1970s, with projects in India, Japan and Kazakhstan. SMRs and microreactors suit water-stressed regions, but the economics are geographically specific.
Medical isotopes. Every operating reactor is also an isotope source, and the chapter treats isotope production as a co-product of the flux. Tc-99m (technetium-99m) is the decay product of molybdenum-99 (Mo-99), made by fission in uranium targets under neutron irradiation. It serves about 35 million imaging procedures a year. Its 6-hour half-life means it cannot be stockpiled, so a reactor outage can cancel hospital appointments days later. Targeted radioligand therapy uses lutetium-177; actinium-225 and astatine-211 come most efficiently from fast-spectrum reactors. Chapter 18 covers the supply chain.
Industrial isotopes. The workhorse of radiation sterilization is cobalt-60 (Co-60), made by neutron activation of cobalt-59. It sterilizes medical devices, implants, some foods and packaging. It also serves weld radiography and density and fill-height measurement. A small number of reactors, mainly in Canada and Russia, supply it. Isotopically pure silicon-28 removes silicon-29 and silicon-30, together about 8% of natural silicon, whose phonon scattering degrades qubit coherence. In research settings it has lengthened coherence times by about six orders of magnitude, from microseconds to seconds.
Space. In space, nuclear thermal propulsion reaches about twice the specific impulse of the best chemical engines, halving propellant mass for a given mission. Launch costs run to thousands of dollars per kilogram and nuclear systems are heavy, but on long missions the propellant saved outweighs the reactor’s mass. TRISO particles are designed to survive launch failure and re-entry intact. On planetary surfaces, the Moon’s roughly 14-day night and a Martian solar resource of about one-third of Earth’s, cut further by months-long dust storms, favor fission power. The NASA and DOE Fission Surface Power project is developing it for near-term lunar deployment.
What the chapter establishes. The applications run from operating industries to development programs. Process heat cogeneration is contracted between X-energy and Dow, isotope production runs continuously, and desalination has been demonstrated. Hydrogen awaits high-temperature reactors, and space power and propulsion are funded government programs. Separate markets with separate analysts obscure one common source. An electricity-only analysis captures only part of a reactor’s value, and reactor economics depend on more than megawatt-hours sold.
Chapter 12 — The Global Fleet Today
The fleet. As of early 2026, IAEA PRIS (Power Reactor Information System) data show about 440 commercial reactors in 31 countries generating about 2,600 TWh a year, roughly 10% of world electricity. Those totals have been broadly stable for a decade as new units offset retirements, while the mix shifts from aging Generation II plants to new designs, many in China. The average capacity factor is about 80–85%, against about 15–25% for solar and 25–45% for wind.
United States. The US runs 93 reactors at 54 sites in 28 states, generating about 775 TWh, about 19% of national electricity in 2024 and more carbon-free power than wind and solar combined. Its fleet is the largest by capacity, though China is likely to pass it within the decade. Average age is approaching 45 years. Most plants hold 20-year extensions beyond their original 40-year licenses, and many seek second extensions to 80 years. A boxed note records that the country produces less than 1% of its uranium requirements. It imports from Kazakhstan, Canada, Australia, Uzbekistan and, until the 2028 phase-out under the Prohibiting Russian Uranium Imports Act, Russia.
China. China has grown from a negligible base in the 1990s to about 57 GW across more than 55 reactors, with more under construction than the rest of the world combined. Roughly 6–8 reactors have been approved or started in most years since 2010, with commissioning about 6–8 years later. Premier Li Keqiang’s 2014 “war on pollution” added urgency, though the program predates it by decades. Chinese uranium consumption, now comparable to the US, will overtake it before 2030, and East Asian inventories exceeded US inventories by late 2024. With the CFR-600 at Xiapu in Fujian, China is the most advanced country in fast reactor commercial deployment outside Russia.
Russia. About 37 domestic reactors supply about 20% of Russian electricity. Rosatom is the largest reactor exporter by units under contract, with projects in Bangladesh, China, Egypt, Hungary, India, Iran, Turkey, Uzbekistan and elsewhere. It supplies design, construction and long-term fuel, often with financing, so a recipient buys Russian enrichment and fabrication for the plant’s life. The BN-600 at Beloyarsk (since 1980) and BN-800 (since 2016) are the world’s only commercially operating fast reactors beyond demonstration scale.
France. About 70% of French electricity comes from 56 EDF pressurized water reactors, built quickly after the 1973 oil crisis on a standardized design. La Hague reprocesses with PUREX for France and for utilities in Germany, Japan and Belgium. MELOX at Marcoule fabricates MOX, on which about two-fifths of the fleet ran in 2024. The cycle recovers the uranium (about 94–96% of spent fuel mass) and returns the plutonium (about 1%) as MOX. The book calls this the most developed partially closed fuel cycle in Western commercial operation. The minor actinides neptunium, americium and curium stay in the waste, and burning them needs fast reactors, which Astrid’s 2019 cancellation left unbuilt. The book calls the remaining gap a deployment gap.
Closures and phase-outs. Germany ran 17 reactors before Fukushima, providing about 22–23% of its electricity, accelerated its phase-out and closed the last three in April 2023, with gas and coal filling the near-term gap. Japan’s roughly 50 reactors had provided about 30%. Essentially the whole fleet shut for reassessment under new Nuclear Regulation Authority standards. About 12 had restarted by 2026, and liquefied natural gas imports contributed to higher import bills and emissions.
India. India has limited uranium but an estimated 30% of global thorium reserves. Since Homi Bhabha’s work in the 1950s it has pursued a three-stage program: pressurized heavy water reactors on domestic uranium, fast breeders that breed U-233 from thorium, and thorium reactors running on that U-233. It operates 23 reactors of about 7 GW, mainly CANDU-derived. The indigenous 500 MW Prototype Fast Breeder Reactor at Kalpakkam reached first criticality on April 6, 2026, and was in power ascension testing by mid-2026, with commercial generation expected later in the year pending AERB approval. That marks the move from Stage 1 to Stage 2; Stage 3 remains in research and development.
Emerging countries. Bangladesh began fuel loading at Rooppur Unit 1 in April 2026, with grid connection expected by mid-2026, which would make it the 33rd country to generate nuclear power. The UAE’s four APR-1400 units at Barakah were all in commercial operation by 2024. Turkey at Akkuyu, under a build-own-operate arrangement, and Egypt at El Dabaa are each building four VVER-1200 units with Rosatom. The common pattern is a comprehensive vendor relationship covering technology, financing, construction and fuel.
What the fleet tells us. The 2026 fleet is predominantly Generation II, near or beyond original design lifetimes, and concentrated in a few countries. The pace of new construction will decide whether capacity grows, holds or declines through the 2030s. About 440 reactors consume roughly 65,000–70,000 metric tons of uranium a year. A fleet of 600 or 700 within 20 years, driven by China and the first Generation IV units, is the trajectory supply investments are sized against. The chapter hands off to Part IV: spent fuel “is what it is because of the physics described in Chapter 8,” in quantities set by this fleet.
Supporting appendices
- Appendix XII — Physics and Mathematics. The four-factor formula k∞ = η·ε·p·f (LWR example k∞ ≈ 1.39, brought to k_eff ≈ 1.00 by leakage) also shows the negative temperature coefficient as a fall in resonance escape probability p, with the RBMK’s opposite sign. Thermal Efficiency and Carnot Limits gives a 47.6% ceiling for an LWR at 315 °C, 69.9% for an HTGR at 750 °C, and cogeneration from 3,000 MWth (1,050 MWe, 1,950 MWth rejected, 80% utilization with heat recovery). The Way-Wigner decay-heat section (P/P₀ ≈ 0.066·t⁻⁰·²) gives 16.4 MW at the AP1000’s 72 hours and notes that the prose figures come from ANS-5.1. Neutron Flux and Reaction Rates (R = Φ·σ·N) works a Mo-99 saturation example. The reaction data give Xe-135’s 2.65 million barns and the 0.65% delayed fraction.
- Appendix XIII — Optional Problem Set. Problem 1-2, The Moderator Choice, shows heavy water’s roughly 650-fold lower capture letting natural uranium reach k∞ ≈ 1.04, where light water gives 0.829. Problem 2-0, The Iodine-Xenon Chain, finds Xe-135 peaking near 43% of the initial I-135 about 12 hours after shutdown. Problem 2-1, The 300-Year Threshold, checks Chapter 8’s fission-product claim. Problem 2-2, Decay Heat and the Cooling Requirement, follows a 3,000 MWth core from about 198 MW at one second to 16.4 MW at 72 hours. Problem 3-1, The Efficiency Ceiling, extends the Carnot arithmetic to the BN-1200M (about 44%) and cogeneration (about 74%).
- Appendix X — Industry and Landscape. Part II, The Generation Landscape, profiles the operators and vendors behind Chapters 9 and 12, from US utilities, OPG, EDF and Rosatom to CNNC, KHNP, NPCIL and the SMR and microreactor developers. Part I’s adjacency map covers Chapter 11’s markets, from isotopes and process heat to desalination and space.
- Appendix VIII — Glossary of Terms gives working definitions, with the chapter of first use, for every term marked here. Appendix IX — Regulatory and Policy Timeline dates the three accidents, Vogtle Unit 3’s commercial operation (July 31, 2023), Part 53’s entry into effect (April 29, 2026), and the 2025–2026 milestones at Darlington, Kalpakkam, Wylfa, Rooppur and Hermes 2.
Longer technical notes and Top Stories tagged to Part III will appear on this page as they are published.


Leave a Reply